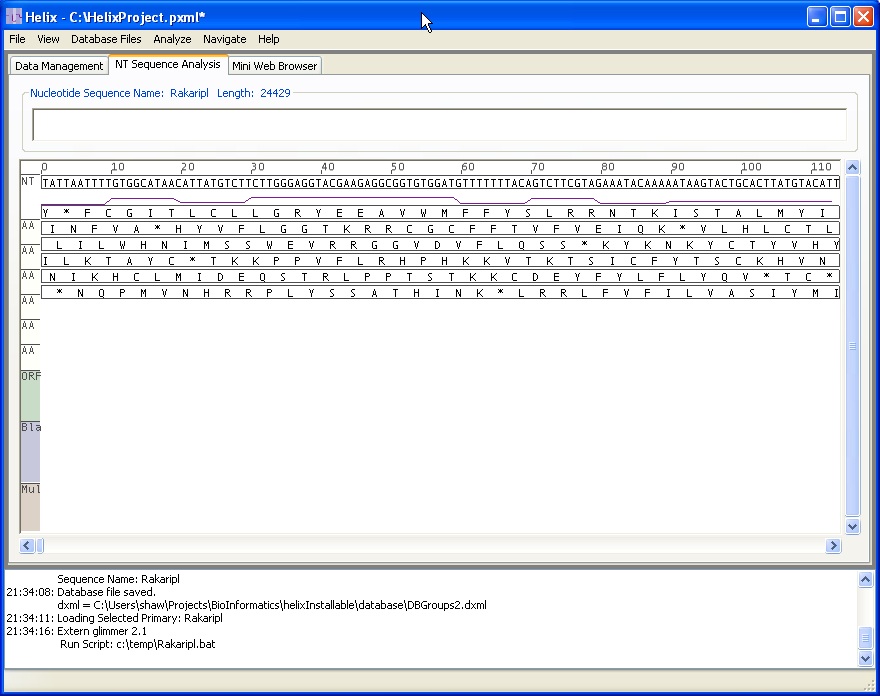

Ths image shows the IMAS NT Analysis pane, in which users translate and zoom the view to analyze the NT sequence along with the 3 possible forward and reverse reading frames. Also shown here is a GC content plot.
The bottom pane contains a log of informational massages from the IMAS system, indicating the sequence file loaded and the database files that will be available.

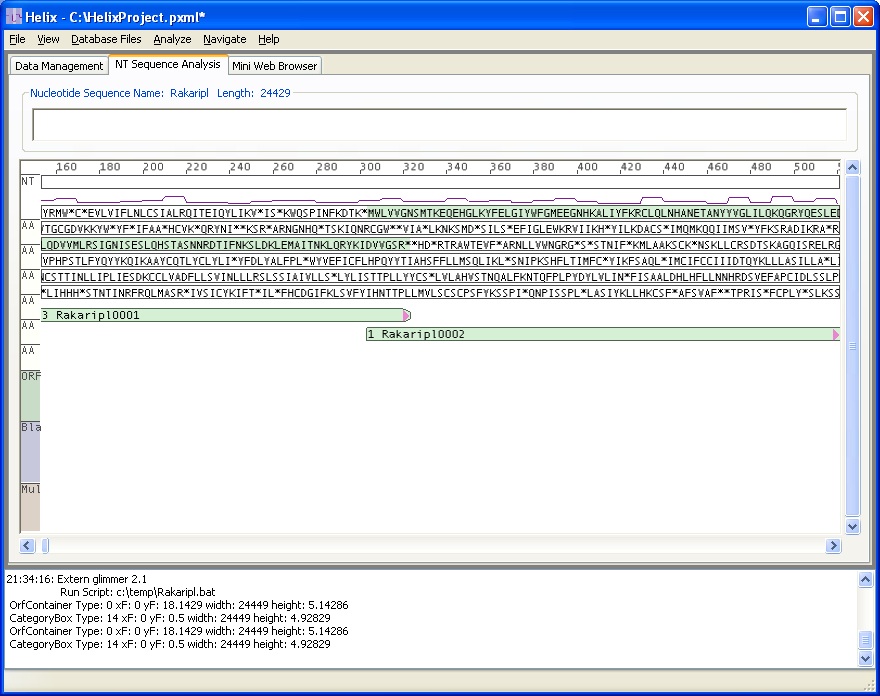
This image shows the same sequence zoomed-out by a factor of 3. IMAS hides the NT sequence at this zoom level to eliminate visual clutter. The visualization shows 2 putative genes labeled Rakaripl0001 and Rakaripl0002 that have been found by running Glimmer. The green boxes show start and stop location along with reading direction. The in-frame AA sequence highlights allow the user to read the AA sequence (MWLVVGS...).

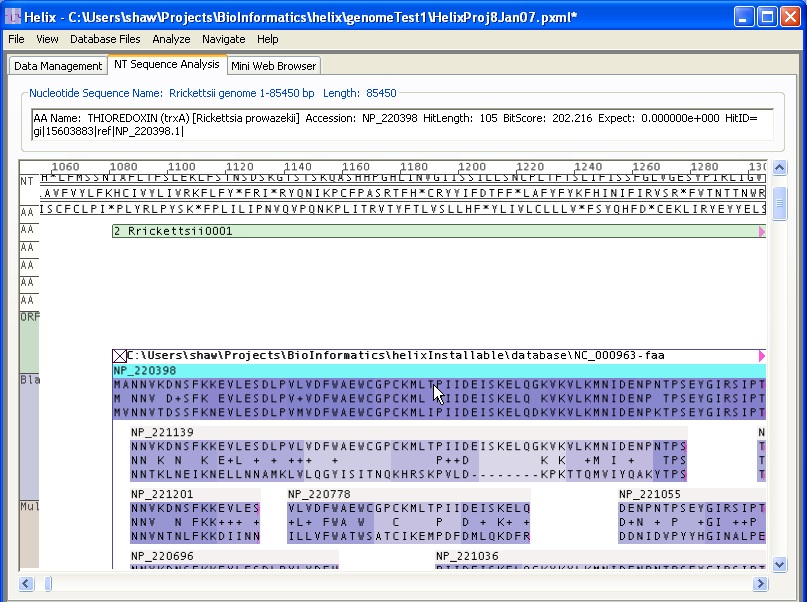
In this case, putative gene Rrickettsii0001 has had a query to the amino acid sequence database NC_000963.faa (Rickettsia Prowazekii). A number of reasonable sequence alignments have been found, and are displayed in place arrayed below the gene in alignment with the query sequence. The visual Blast alignment that is highlighted by a cyan bar is the most salient hit: NP_220398, THIOREDOXIN (trxA) [Rickettsia prowazekii]. The text box just below the tabs indicates the data about the expected value of this Thioredoxin Blast hit. Other hits are shorter and have more gaps. The dark blue color indicates the quantitative alignment score, with darker blue indicating higher alignment score. Note that the gap in the second alignment (NP_221139) is nearly white, indicating bit score in that region close to 0.